

Meteorology (or „atmospheric physics“) is part of physics that deals with the composition, structure, properties, phenomena, and events taking place in Earth’s atmosphere – such as weather (ie immediate condition of air in a given venue).


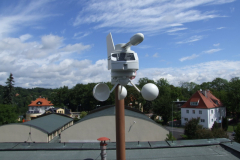
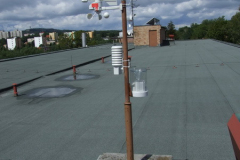
The interactive exhibit of weather station serves to a closer acquaintance with the principles, measurement and processing of meteorological data. basic components of the weather station are outdoor sensors mounted on the roof of the school building, a data collection and display unit, followed by software, allowing the preservation of data, their graphical display and charting, as well as the transmission of basic data onto the web portal.

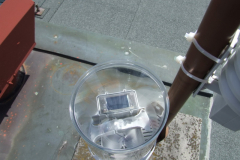
Interestingly, the rainfall and wind speed/direction sensors use an environmentally friendly source of energy for their activity – they have their own solar cell.

Data transfer from the outdoor sensors to the data collection and display panel is done wirelessly (via radio signal at 868 MHz).
Basic properties of the weather station used:
• Weather forecast with 3 symbols (sunny, cloudy, rainy)
• Temperature unit ° C or ° F
• dew point, feel temperature (wind chill)
• min, max. values of temperature, humidity and dew point with time saving
• display of relative pressure in hPa or mm Hg
• graphical representation of the pressure
• display of wind speed (option in km / h, m / s, mph, knots and Beaufort scale)
• Wind direction displayed in the form of wind rose
• pointer to maximum gusts of wind with time and date of deposit
• precipitation (mm)
• the total amount of precipitation – rainfall in the last hour, last 24 hours, last week, last month
• Alarm mode for: temperature, humidity, wind gusts, wind direction, air pressure, rainfall, and 24 storm warnings
• Stores up to 1750 weather records in the memory panel on the 1-minute intervals up to 24 hours
• Time (12/24 hour clock)
• Automatic updates of time and data from your PC
• Calendar

Students have the chance to learn with all the components in this exhibit. Station software is installed and running on an assigned computer in the physics lab, and a program window is displayed on the LCD screen located on the second storey corridor of A-pavilion along with other exhibits to teach physics


Troposphere (the lower part of the Earth’s atmosphere)
Source:
http://upload.wikimedia.org/wikipedia/commons/4/4b/Meteotek08_atmosfera03.jpg
The Earth’s atmosphere is a gaseous shell surrounding our planet, which is kept in place by earth gravity. It contains approximately 78% nitrogen and 21% oxygen, with trace amounts of other gases and solid and liquid particles. The atmosphere protects life on earth from harmful solar and cosmic radiation, and its thermal inertia reduces the temperature differences between day and night.

Source: http://www.theozonehole.com/atmosphere.htm
It is the task of General meteorology to measure the
meteorologic elements,
among which belong for instance

• air pressure (atmospheric pressure)
• air temperature
• humidity
• solar radiation
• wind speed and direction
• clouds and precipitation
The meteorological elements are linked to one another, they affect weather to varying degrees, and during the day and year, their meaning changes.
If we know the physical characteristics of the atmosphere, we can determine the weather forecast. Meteorologists today use modern technology – satellites, electronic measurement systems, and computers.

Source: http://www.streckenflug.at/blog/wp-content/gallery/1368km/wetter_met.jpg

The temperature and composition of Earth’s atmosphere varies according to altitude; however specific correlation between height and temperature also varies with altitude. According to this relationship, we divide the earth’s atmosphere into these atmosphere layers:
• troposphere: The name comes from the Greek word „tropos“. Troposphere extends from the ground up to 7 km in the polar regions and 17 km around the equator and is the lowest layer of the atmosphere at all. Troposphere temperature decreases with altitude.
• stratosphere: extends from the end of the troposphere to approximately 50 km. Temperature increases with altitude.
• mesosphere: extends from the end of the stratosphere, approximately 80 to 85 km. Temperature decreases with altitude.
• thermosphere: mesosphere extends from the end to a distance of about 640 km from the surface. Temperature increases with altitude.
• exosphere: extends roughly from the end of the thermosphere to 20,000-70,000 km from the surface (to where the number of particles decreases to 1 / 10 of the average values in the troposphere). Temperature decreases with altitude.
The boundaries between these layers are called tropopause, stratopause, mesopause and thermopause.
Atmospheric pressure
Weight of air in the atmosphere creates atmospheric pressure, which is usually measured in hectopascals (hPa). The average atmospheric pressure at sea level is called the normal atmospheric pressure and has a value of 1013.25 hPa. Atmospheric pressure decreases with increasing altitude. Atmospheric pressure is very important for weather prediction.The absolute value of the atmospheric pressure is not as important as the change and rate of change. Warm air has a lower density, whereas cold air, by contrast, a higher density. Increasing pressure usually signals sunny weather, a decrease rather cloudy and rainy weather.
The device which records the pressure is called a barometer.
Air Temperature
Meteorologists measure air temperature at a height of 2 m from the ground in a weather booth. The measured values are indicated by the Celsius scale. The temperature is different at different heights – in the lower altitudes the temperature is higher, and, analogically, at higher altitudes it is lower. However, a situation may also arise in which it will not be the case. This air temperature reversal is called inversion. Temperature is measured with a thermometer.
Humidity
Humidity is the amount of water vapor in the air. Water vapor in the air are a condition for the formation of clouds and precipitation. Relative humidity means the degree of saturation of air with water vapor. It is the ratio between the actual water vapor content and the maximum possible content of vapor at a given temperature. Relative humidity is indicated in %. 100% relative humidity is air saturated with steam. This case occurs for example when mists appear. The temperature at which the vapor contained in the air becomes saturated is called the dew point. The average relative humidity is highest in November, December and January. The lowest it is between April and August. Humidity is measured with a hygrometer (hygrometer).
Solar radiation
The apparatus for measuring the length and intensity of solar radiation is called heliograph.It is a glass ball which concentrates solar radiation on a piece of paper where the concentrated radiation burns a track. In the Czech Republic, the sun shines an average of about 1700 hours per year.
Wind direction and wind speed
Wind is the movement of air in the atmosphere. Movement occurs in an attempt to equalize pressure in different places. The air moves both horizontally and vertically. The air flow also depends on rainfall. People mistakenly think that wind direction says where the wind blows. This is exactly on the contrary. The frequency of winds is then drawn into wind rosettes. Devices measuring ground winds speed are called anemometers. Height winds are measured by weather balloons.
Strong winds that reach speeds of over 240 km / h and even as much as 50% higher in short-term rate are called tornadoes (storm). They generally flow from the sea, where there are no obstacles. In the center of a tornado/storm there are whirls.
Cloudiness and precipitation
There is a close link between air humidity on one hand and clouds and precipitation on the other. If the air cools enough, it is possible that the water contained in it in the form of vapor begins to condense in the form of droplets. There are not downfalls in all the clouds. Deductions are also various forms – rain, snow, hail.
Clouds are classified according to their shape and height above the ground. The phenomenon, in which there are both strong and short rainfall and electrical discharges (lightning) is called a thunderstorm. Thunderstorms are most common in tropical summer days.
Precipitation is measured in mm, and the device that records their intensity is called a rain gauge (pluviometer).
| Latitude: N 50°04′ 34″ Longitude: E 12° 21′ 44″ |
Coordinates of station location:

Technical specifications of the weather station:
• Indoor / Outdoor temperature Range: -40 ° C to +59.9 ° C with a resolution of 0.1 ° C
• indoor / outdoor humidity range: 1% to 99% with 1%
• Air speed / gust range: 0 to 180 km / h with resolution 0.36 km / h (0
to 50 m / s with a resolution of 0.1 m / s)
• Emotional temperature (wind chill) Range: -40 ° C to +59.9 ° C with a resolution of 0.1 ° C
• Rainfall: 0 to 9999.9 mm
• Interval of sending data to outdoor temperature / humidity sensor:13 s
• Interval of sending data anemometer: 17 sec
• Interval of sending data to gauge: 19 sec
• Air Pressure: preset for rel. pressure from 920 to 1080 hPa, measured every 15 s
• Max. range for wireless outdoor temperature / humidity sensor: 100 m
• Max. wireless communication range for the anemometer: 50 m
• Max. wireless communication range for rain gauge: 50 m
• Power supply – Main Unit: 3 x 1.5 V batteries type C
• Power supply – outdoor temperature / humidity sensor: 2 x 1.5 V batteries type C
• Power supply – anemometer: solar cell-powered
• Power Supply – rain gauge: solar cell-powered
• Weight: 2,500 g
• Size – the main part: 222.2 x 34.7 x 163.2 mm
• Dimensions – sensor for measuring temperature / humidity: 79.4 x 89.8 x 189.3 mm
• Dimensions – anemometer: 250 x 145.9 x 282.2 mm
• Dimensions – rain gauge: average 131.6 x 182.7 mm
Thermal comfort
Thermal comfort is a relative term. The boundaries of thermal comfort will vary from person to person. Thermal comfort depends on physical condition and activity of man. If you are not too warm and feel cold, we can say that you are in a state of thermal comfort. The basic condition for thermal comfort is adequate air temperature in the room, but this is not the only condition. The temperature of room equipment and walls, as well as room humidity, is also important. Given the air temperature is 20 ° C the surface temperature of the walls should not fall below 18 °
C. At lower surface temperatures we would have to increase the air temperature, thus the water vapor would condensate on the walls and thermal comfort would deteriorate. Insufficient insulation of walls has resulted in low surface temperature. A Relative humidity of 30 to 50% is recommended in rooms. At lower humidity, evaporation from our bodies increases – they cool down. However at higher values of humidity water evaporates from the body badly, which makes us sweat. Ventilation increases and heating decreases the relative humidity of air.
Recommended room temperature
| living rooms | 18 – 22oC |
| kitchen | 15oC |
| bathroom | 24oC |
| toilet | 16oC |
| hall, stairway | 10-15oC |

Recommended temperature for activities
| at rest | 19 – 22oC |
| light physical work | 18 – 20oC |
| moderate physical work | 14 – 17oC |
| hard physical work | 10 – 15oC |


